Quality (or Vapor Quality) and Two-Phase Mixture Properties
\(\displaystyle x = \frac{m_{g}}{m_{f} + m_{g}}\)
\(\displaystyle v = (1-x)v_f + xv_g = v_f + x(v_g - v_f)\)
\(\displaystyle u = (1-x)u_f + xu_g = u_f + x(u_g - u_f)\)
\(\displaystyle h = (1-x)h_f + xh_g = h_f + x(h_g - h_f)\)
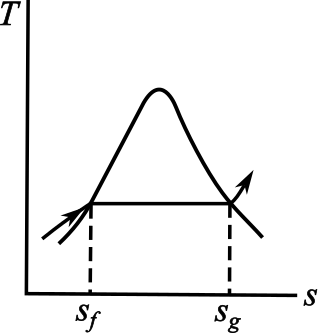
\(\displaystyle s = (1-x)s_f + xs_g = s_f + x(s_g - s_f)\)
Symbols
- \(x\) — quality (or vapor quality)
- \(m\) — mass
- \(v\) — specific volume
- \(u\) — specific internal energy
- \(h\) — specific enthalpy
- \(s\) — specific entropy
- subscript \(f\) — saturated liquid state
- subscript \(g\) — saturated vapor state
Schematic
Inputs & Outputs
The fluid is water.
Saturation pressure \(P_{\text{sat}}\)
— bar
Sat. liquid \(v_f\)
— m³/kg
Sat. vapor \(v_g\)
— m³/kg
Specific volume \(v\)
— m³/kg
Sat. liquid \(u_f\)
— kJ/kg
Sat. vapor \(u_g\)
— kJ/kg
Specific int. energy \(u\)
— kJ/kg
Sat. liquid \(h_f\)
— kJ/kg
Sat. vapor \(h_g\)
— kJ/kg
Specific enthalpy \(h\)
— kJ/kg
Sat. liquid \(s_f\)
— kJ/(kg·K)
Sat. vapor \(s_g\)
— kJ/(kg·K)
Specific entropy \(s\)
— kJ/(kg·K)
Plots
The red dot marks the state point for the current temperature and quality.
Use the inputs above to move it, or drag it directly on any of the plots.